
内容纲要
什么是 Zabbix ?
Zabbix 是一种系统监控。网络监控、服务监控工具。
监控对象
- 主机
- 软件
模块功能
- Monitoring
- 信息聚合
- 状态展示
- 信息查询
- 监控统计
- Inventory
- 资产信息
- 管理
- 查询
- Report
- 报表
- 审计
- 日志
- Configuration
- 主机信息配置
- 监控规则配置
- 报警规则配置
- 统计图表配置
- 自动发现配置
- Administrator
- 用户权限管理
- 报警方式配置
- 脚本配置
- 代理配置
- Personal
- 接收报警配置
- 接收报警规则
- 个人信息管理
Zabbix 特点
- 安装简单
- 监控方便
- 免费开源
- 自动化
- C/S 结构、分布式架构
与同类型比较
| 系统名称 | 默认监控 | 自定义监控 | 批量监控 | 修改监控 | 图表 | 报警 | 其他 |
|---|---|---|---|---|---|---|---|
| Zabbix | 自带监控多 | 可自定义编写插件 | server 端可配置自动注册规则;client 端无需操作 | 手动在模板中新增监控 | 自带图表插件 | 支持多种报警,依赖插件 | 自带 Web 监控 |
| Nagios | 自带监控少 | 可自定义编写插件 | 用脚本在 server 端新增 host, 并拷贝 service 文件 | 用脚本修改所有主机的 service 文件,加入新增服务 | 可以按照图表插件 | 支持多种报警,依赖插件 |
注意 ↓
- Zabbix 使用更友好,探索功能需要较多时间,学习成本较大
- Nagios 容易上手,脚本很强大,但写起来也费时费力
架构图
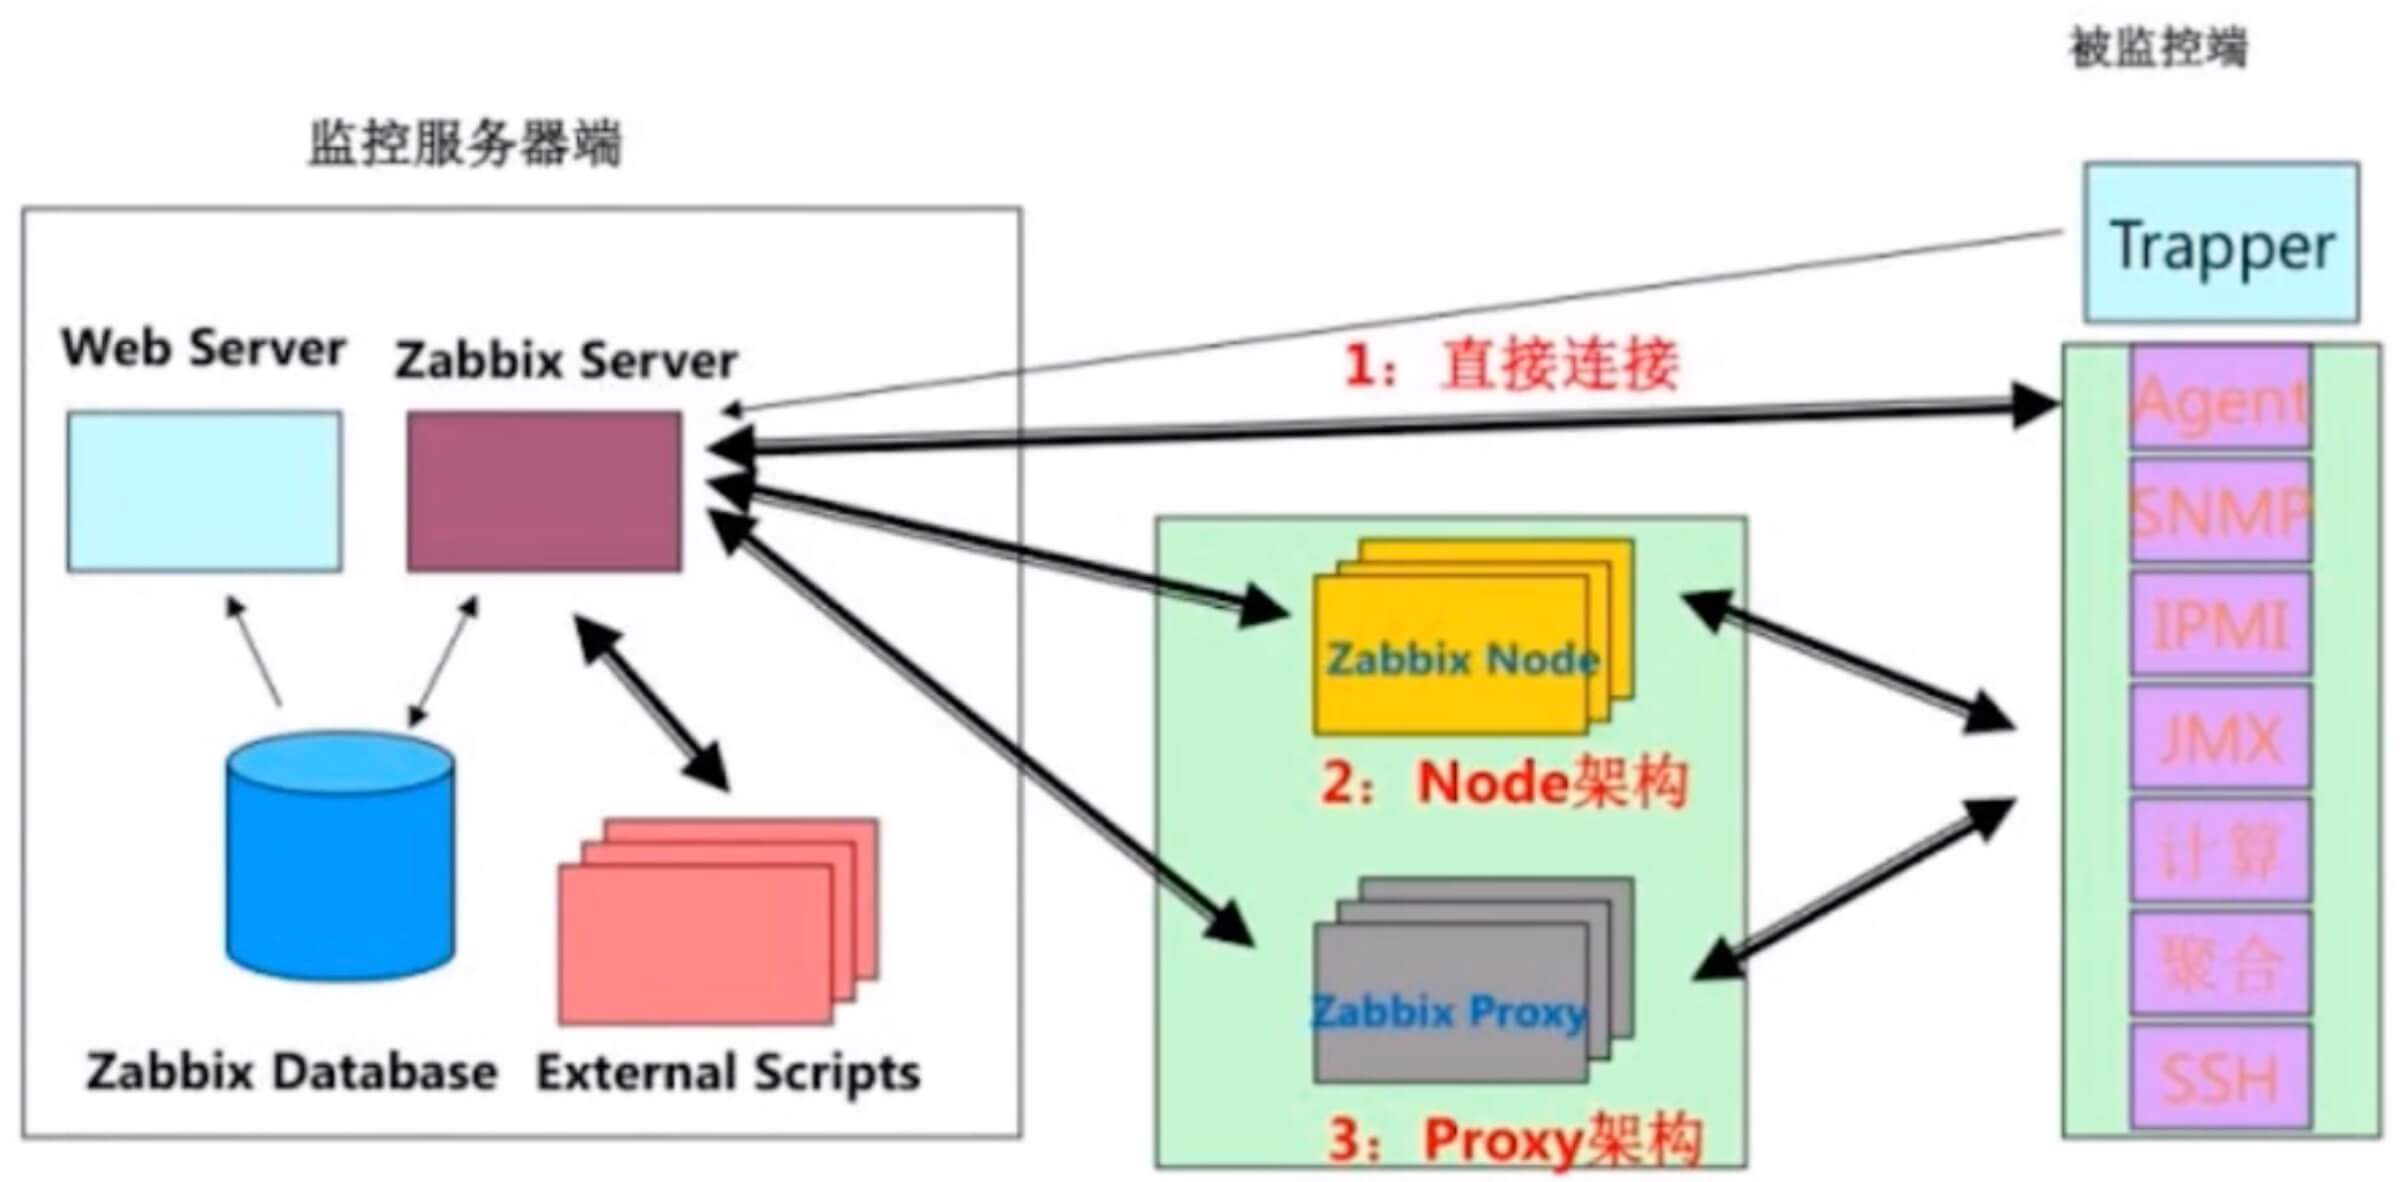
部署方式
- 网络协议模式:server-client
- 代理模式:server-proxy-client
- 节点模式:master-node-client
使用
安装
- 打开官网下载页面
- 选择操作系统
- 按引导安装
- 安装 Server 端
- 添加源
- 安装 Server
- 安装 MySQL
- 初始化 MySQL
- 启动 zabbix-server
- 安装 Web 端
- 安装 Web
- 配置 timezone:
$ vim /etc/php-fpm.d/zabbix.conf; php_value[date.timezone] = Asian/Shanghai
- 启动 [httpd|nginx|apache2] php-fpm
- 打开
http://[ip]/zabbix- 默认用户密码:
Admin : zabbix
- 默认用户密码:
- 安装 Agent 端
- 添加源
- 安装 Agent
- 配置连接的 Server
$ vim /etc/zabbix/zabbix_agentd.conf
- 启动 zabbix-agent
- 安装 Server 端
踩坑指南
注意 ↓
- Mariadb 代替 MySQL
- 关闭 SeLinux,否则可能出现:cannot set resource limit
- 默认使用 httpd 作为 Web 服务
Web 使用
配置自动发现
op1=>operation: Configuration
op2=>operation: Discovery
op3=>operation: Create Discovery Rules
op4=>operation: Create Rules

op1(right)->op2
op2(right)->op3
op3(right)->op4
配置报警
op1=>operation: Configuration
op2=>operation: Create Action
op3=>operation: Create Condition
op4=>operation: Create Operation

op1(right)->op2
op2(right)->op3
op3(right)->op4
配置发送报警
op1=>operation: Administrator
op2=>operation: Media Type
op3=>operation: Email
op4=>operation: Update

op1(right)->op2
op2(right)->op3
op3(right)->op4
配置接收报警
op1=>operation: Administrator
op2=>operation: Users
op3=>operation: Admin
op4=>operation: Media
op5=>operation: Add

op1(right)->op2
op2(right)->op3
op3(right)->op4
op4(right)->op5
配置统计图表
op1=>operation: Configuration
op2=>operation: Hosts
op3=>operation: Graphs
op4=>operation: 条目选择

op1(right)->op2
op2(right)->op3
op3(right)->op4
配置聚合图表
op1=>operation: Monitoring
op2=>operation: Screens
op3=>operation: Add
op4=>operation: Edit Screen

op1(right)->op2
op2(right)->op3
op3(right)->op4
用户管理
op1=>operation: Administrator
op2=>operation: Users
op3=>operation: User Groups

op1(right)->op2
op2(right)->op3
配置聚合图表
op1=>operation: Monitoring
op2=>operation: Screens
op3=>operation: Add
op4=>operation: Edit Screen

op1(right)->op2
op2(right)->op3
op3(right)->op4
通用设置套路
op1=>operation: 创建监控脚本
op2=>operation: 创建 Zabbix Item
op3=>operation: 创建 Zabbix Trigger
op4=>operation: 创建 Zabbix Action

op1(right)->op2
op2(right)->op3
op3(right)->op4
Web API
功能
- 远程管理 Zabbix 配置
- 远程检索配置和历史数据
接入方式
http://[ip]:[port]/zabbix/api_jsonrpc.php- 使用 JSON-RPC 实现
- 数据传输以 JSON 格式
- Headers
Content-Type: application/json-rpcContent-Type: application/jsonContent-Type: application/jsonrequest
接入步骤
- 登录获取 token
- 请求头带入 Authorization: [token]